
Vision 2030: Dashboard Indicators - 2024 progress
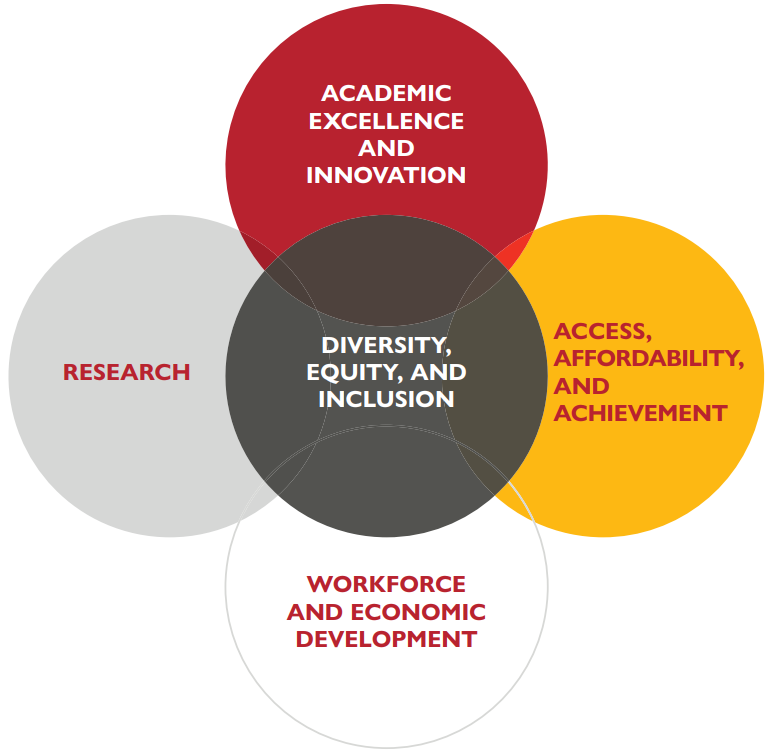
 Academic Excellence and Innovation
$411 million
Total private funds raised annually by USM
$384 million
Target
 Access, Affordability, and Achievement
131,000
Target
25%
Target
 Workforce and Economic Development
27,100
Target
12,500
Target
1,656
Target
 Research
$1,431 million
Annual R&D expenditures
$1,460 million
Target
$754 million
Annual federal R&D expenditures in academic disciplines aligned with national research priorities
$775 million
Target
Diversity, Equity, and Inclusion
10,799
Target